Commercial Bancgroup, Inc. Announces Results for the First Quarter 2026
 HARROGATE, TN / ACCESS Newswire / April 27, 2026 / Commercial Bancgroup, Inc. ("Commercial" or the "Company") (Nasdaq:CBK), the parent company of Commercial Bank (the "Bank"), today announced net income of $9.5 million, or $0.70 per common share, for the first quarter of 2026, compared to net income of $8.7 million, or $0.72 per common share, for the first quarter of 2025. Core (net of any one-time adjustments) net income was 10.0 million, or $0.73 per common share, for the first quarter of 2026, compared to core net income of $8.7 million, or $0.72 per common share, for the first quarter of 2025.
Prior to Commercial's initial public offering ("IPO") of it's common stock in October 2025, Commercial had three classes of common stock outstanding: common stock, Class B common stock, and Class C common stock. On September 18, 2025, Commercial's charter was amended and restated. The Company's amended and restated charter provided for, among other things:
effective upon the filing of the amended and restated charter, the reclassification and conversion of (i) each outstanding share of Class B common stock into 1.15 shares of common stock and (ii) each outstanding share of Class C common stock into 1.05 shares of common stock (collectively, the "Stock Reclassification"); and
effective immediately following the Stock Reclassification, a 250-for-1 forward stock split in respect of the outstanding shares of our common stock (the "Stock Split").
Our financial statements, including earnings per share and book value per share, reflect the stock Reclassification and Stock Split retroactively. Because the IPO occurred after September 30, 2025, the financial impacts of the IPO are reflected for the fourth quarter of 2025 in the financial statements presented in this press release.
First Quarter 2026 Performance Highlights:
Net income of $9.5 million or $0.70 per common share; Core net income of $10.0 million or $0.73 per common share (see non-GAAP reconciliation)
Return on average assets ("ROAA") of 1.66%; Core return on average assets of 1.74% share (see non-GAAP reconciliation)
Return on average equity ("ROAE") of 13.22%; Core return on average equity of 13.87% share (see non-GAAP reconciliation)
Return on average tangible common equity ("ROATCE") of 13.76%; Core return on average tangible common equity of 14.44% (see non-GAAP reconciliation)
Net interest margin of 3.88%, a decrease of 13 basis points from the fourth quarter of 2025
Core efficiency ratio of 45.45% share (see non-GAAP reconciliation)
Total loans increased $18.1 million during the quarter, or 4.0% annualized, from the fourth quarter of 2025
Book value per share increased $0.60, or 11.5% annualized, to $21.43 and tangible book value per share increased $0.62, or 12.4% annualized, to $20.60 at March 31, 2026 from the $20.83 and $19.98, respectively, at December 31, 2025 (see non-GAAP reconciliation)
Net charge-offs to average loans of 0.01% and nonperforming assets to total assets of 0.28%
Redeemed $6.2 million in principal amount of trust preferred securities
Year-Over-Year Highlights:
Net income of $9.5 million or $0.70 per share for the three months ended March 31, 2026, compared to $8.7 million or $0.72per share for the three months ended March 31, 2025.
Return on average assets of 1.66% for the three months ended March 31, 2026, compared to 1.52% for the three months ended March 31, 2025.
Return on average shareholders' equity of 13.22% for the three months ended March 31, 2026, compared to 15.81% for the three months ended March 31, 2025.
Total operating revenue of $23.1 million for the three months ended March 31, 2026, compared to $21.8 million for the three months ended March 31, 2025.
Non-interest expense of $11.1 million for the three months ended March 31, 2026, compared to $10.6 million for the three months ended March 31, 2025.
Tangible book value per share of $20.60 per share as of March 31, 2026, compared to $17.45 per share as of March 31, 2025 (see non-GAAP reconciliation).
Core Efficiency ratio of 45.5% for the three months ended March 31, 2026, compared to 48.6% for the three months ended March 31, 2025.
The Federal Reserve Bank of Atlanta raised the Bank's Community Reinvestment Act rating from Needs to Improve to Satisfactory.
Balance Sheet Trends
Total assets were $2.3 billion as of March 31, 2026, compared to $2.3 billion as of March 31, 2025.
Total net loans were $1.9 billion as of March 31, 2026, an increase of $96.8 million, or 5.4%, from March 31, 2025. While the Bank experienced various large loan payoffs from long-term borrowers selling businesses during 2025, the Bank had strong loan growth during the fourth quarter of 2025. Total net loans increased by $18.4 million or 1.0% from $1.9 billion as of December 31, 2025.
As of March 31, 2026, the Bank exceeded the minimum requirements to be well-capitalized for bank regulatory purposes, with a total risk-based capital ratio of 14.0%, a Tier 1 risk-based capital ratio of 13.0%, a common equity Tier 1 capital ratio of 13.0%, and a Tier 1 leverage ratio of 11.1%.
Total deposits were $1.9 billion as of March 31, 2026, a decrease of $10.0 million, or 0.5%, from March 31, 2025. This decrease was primarily driven by a $103.8 million reduction in brokered deposits to $41.5 million at March 31, 2026, from $145.3 million at March 31, 2025.
Noninterest bearing demand deposits decreased $16.7 million, or 4.0%, to $403.0 million as of March 31, 2026, from $419.8 million as of March 31, 2025.
Non-brokered deposits were $1.9 billion as of March 31, 2026, an increase of $93.9 million, or 5.3%, from March 31, 2025. This increase was primarily driven by normal customer business cycles.
Asset quality decreased slightly with nonperforming assets to total assets of 0.28% as of March 31, 2026 as compared to 0.24% as of March 31, 2025. The allowance for credit losses to total loans decreased slightly to 0.97% as of March 31, 2026 from 1.01% as of March 31, 2025.
Net Income Before Income Taxes
Net income before income taxes was $11.9 million for the three months ended March 31, 2026, an increase of $0.7 million, or 5.9%, from the three months ended March 31, 2025. The increase was primarily the result of an increase in net interest income after provision for credit losses of $1.0 million or 5.3% an increase in non-interest income of $0.2 million or 6.1% net of an increase of noninterest expense of $0.5 million or 4.8%.
Non-Interest Income
Non-interest income was $2.6 million for the three months ended March 31, 2026, an increase of $0.2 million, or 6.1%, as compared to the three months ended March 31, 2025. This increase was primarily due to an increase in customer service and ATM fees.
About Commercial Bancgroup, Inc.
Commercial Bancgroup, Inc. is a bank holding company headquartered in Harrogate, Tennessee. Through our wholly owned subsidiary, Commercial Bank, a Tennessee state-chartered bank, we offer a suite of traditional consumer and commercial banking products and services to businesses and individuals in select markets in Kentucky, North Carolina, and Tennessee. More information about Commercial can be found on its website at www.cbtn.com.
Commercial Bancgroup, Inc.
Financial Tables
Table 1A
For the Three Months Ended
As of and for the Twelve Months Ended
March 31, 2026
December 31, 2025
September 30, 2025
June 30, 2025
March 31, 2025
December 31, 2025
December 31, 2024
$
29,463
$
29,958
$
30,021
$
30,859
$
30,766
$
121,604
$
123,213
8,985
9,148
9,799
10,800
11,426
41,173
45,629
20,478
20,810
20,222
20,059
19,340
80,431
77,584
122
463
-
-
-
463
1,829
20,356
20,347
20,222
20,059
19,340
79,968
75,755
2,591
2,667
2,626
2,194
2,443
9,930
10,878
11,087
10,623
10,552
10,725
10,581
42,480
46,061
11,860
12,391
12,296
11,528
11,202
47,418
40,572
2,326
2,224
2,829
2,658
2,510
10,221
8,886
9,534
10,167
9,467
8,870
8,692
37,197
31,686
-
-
-
-
-
-
276
9,534
10,167
9,467
8,870
8,692
37,197
31,410
470
-
-
-
-
231
-
10,004
10,167
9,467
8,870
8,692
37,428
31,410
(1) Considered non-GAAP financial measure - See "Non-GAAP Financial Measures" and reconciliation of non-GAAP financial measures at table 10
For the Three Months Ended
As of and for the Twelve Months Ended
March 31, 2026
December 31, 2025
September 30, 2025
June 30, 2025
March 31, 2025
December 31, 2025
December 31, 2024
$
0.70
$
0.74
$
0.77
$
0.72
$
0.72
$
2.95
$
2.58
$
0.69
$
0.74
$
0.77
$
0.72
$
0.72
$
2.95
$
2.54
$
21.43
$
20.83
$
20.03
$
19.22
$
18.48
$
20.83
$
18.18
$
20.60
$
19.98
$
19.05
$
18.22
$
17.45
$
19.98
$
17.11
13,697,987
13,697,987
12,239,644
12,239,644
12,239,644
13,697,987
12,113,114
13,746,198
13,704,030
12,240,568
12,239,644
12,137,013
12,611,170
12,367,248
(1) Considered non-GAAP financial measure - See "Non-GAAP Financial Measures" and reconciliation of non-GAAP financial measures at table 10
As of and for the Three Months Ended
As of and for the Twelve Months Ended
March 31, 2026
December 31, 2025
September 30, 2025
June 30, 2025
March 31, 2025
December 31, 2025
December 31, 2024
$
2,328,789
$
2,291,455
$
2,214,408
$
2,262,511
$
2,266,878
$
2,291,455
$
2,301,211
42,175
43,137
29,556
30,113
48,830
43,137
47,938
96,387
97,728
131,915
157,452
140,019
97,728
128,217
1,892,174
1,873,533
1,767,193
1,791,516
1,795,178
1,873,533
1,806,997
18,329
18,096
17,942
17,989
18,109
18,096
18,205
12,392
12,767
13,149
13,546
13,938
12,767
14,339
1,892,217
1,815,734
1,780,634
1,851,248
1,902,206
1,815,734
1,938,597
1,733,718
1,665,470
1,631,921
1,628,816
1,659,301
1,665,470
1,669,380
118,248
166,838
162,760
148,509
109,090
166,838
109,165
293,518
285,344
245,153
235,268
226,179
285,344
220,256
(1) Considered non-GAAP financial measure - See "Non-GAAP Financial Measures" and reconciliation of non-GAAP financial measures at table 10
Table 1B
As of and for the Three Months Ended
As of and for the Twelve Months Ended
March 31, 2026
December 31, 2025
September 30, 2025
June 30, 2025
March 31, 2025
December 31, 2025
December 31, 2024
$
11,982
$
12,854
$
12,296
$
11,528
$
11,202
$
47,880
$
42,401
1.66
1.76
1.69
1.57
1.52
1.61
1.40
13.22
15.46
15.81
15.57
15.81
15.60
15.30
13.76
16.40
16.65
16.43
16.75
16.55
16.49
3.27
3.34
3.32
3.11
2.98
3.20
3.05
3.88
4.01
4.02
3.84
3.63
3.87
3.75
1.82
1.88
2.07
2.18
2.25
2.10
2.31
45.45
45.24
46.19
48.20
48.57
47.01
48.92
0.45
0.47
0.48
0.39
0.43
0.44
0.49
1.93
1.87
1.94
1.91
1.85
1.90
2.08
1.36
1.39
1.36
1.31
1.30
1.34
1.32
0.13
0.12
0.11
0.10
0.10
0.11
0.09
(1) Considered non-GAAP financial measure - See "Non-GAAP Financial Measures" and reconciliation of non-GAAP financial measures at table 10
As of and for the Three Months Ended
As of and for the Twelve Months Ended
March 31, 2026
December 31, 2025
September 30, 2025
June 30, 2025
March 31, 2025
December 31, 2025
December 31, 2024
0.01
%
0.01
%
0.00
%
0.01
%
0.01
%
0.03
%
0.01
%
0.97
%
0.97
%
1.02
%
1.00
%
1.01
%
0.97
%
1.01
%
313
%
290
%
333
%
307
%
375
%
313
%
375
%
0.31
%
0.33
%
0.31
%
0.33
%
0.27
%
0.31
%
0.27
%
0.28
%
0.28
%
0.27
%
0.30
%
0.24
%
0.28
%
0.24
%
x
As of and for the Three Months Ended
As of and for the Twelve Months Ended
March 31, 2026
December 31, 2025
September 30, 2025
June 30, 2025
March 31, 2025
December 31, 2025
December 31, 2024
99.03
%
102.19
%
99.25
%
96.77
%
94.37
%
102.19
%
93.21
%
21.22
%
21.91
%
22.39
%
22.53
%
22.05
%
21.91
%
20.46
%
12.60
%
12.45
%
11.07
%
10.40
%
9.98
%
12.45
%
9.57
%
12.18
%
12.01
%
10.59
%
9.92
%
9.48
%
12.01
%
9.07
%
12.32
%
12.19
%
11.03
%
10.22
%
9.63
%
12.19
%
9.51
%
14.73
%
14.99
%
12.83
%
12.26
%
11.62
%
14.99
%
11.11
%
15.68
%
15.96
%
14.12
%
13.55
%
12.90
%
15.96
%
12.37
%
34
34
34
34
34
34
34
287
287
287
289
284
287
279
(1) Considered non-GAAP financial measure - See "Non-GAAP Financial Measures" and reconciliation of non-GAAP financial measures at table 10
Table 2
March 31, 2026
December 31, 2025
September 30, 2025
June 30, 2025
March 31, 2025
$
151,610
$
118,989
$
122,945
$
108,501
$
113,190
16,784
25,329
31,841
42,782
37,303
138,562
140,865
161,471
187,565
188,849
1,892,174
1,873,533
1,767,193
1,791,516
1,795,178
(18,329
)
(18,096
)
(17,942
)
(17,989
)
(18,109
)
1,873,845
1,855,437
1,749,251
1,773,527
1,777,069
49,445
49,765
50,268
50,337
50,038
575
253
533
861
565
46,469
46,648
46,482
46,480
46,191
12,392
12,767
13,149
13,546
13,938
1,056
1,003
1,427
1,029
1,029
38,049
40,399
37,041
37,883
38,706
$
2,328,789
$
2,291,455
$
2,214,408
$
2,262,511
$
2,266,878
973,678
913,986
928,958
926,886
960,915
415,132
414,716
382,002
382,788
390,491
503,408
487,032
469,674
541,574
550,800
1,892,217
1,815,734
1,780,634
1,851,248
1,902,206
45,068
88,251
62,663
46,300
5,900
73,181
78,587
100,097
102,209
103,190
2,644
2,962
3,410
4,545
5,157
22,161
20,576
22,451
22,941
24,246
2,035,271
2,006,110
1,969,255
2,027,243
2,040,699
137
137
122
122
122
38,536
38,377
8,406
8,406
8,406
255,670
247,505
237,366
227,900
219,000
(825
)
(675
)
(741
)
(1,160
)
(1,349
)
293,518
285,344
245,153
235,268
226,179
$
2,328,789
$
2,291,454
$
2,214,408
$
2,262,511
$
2,266,878
x
Table 3
For the Three Months Ended
As of and for the Twelve Months Ended
March 31, 2026
December 31, 2025
September 30, 2025
June 30, 2025
March 31, 2025
December 31, 2025
December 31, 2024
$
27,675
$
27,866
$
28,074
$
28,432
$
27,930
$
112,301
$
113,391
838
739
929
1,070
975
3,714
2,679
114
114
102
116
110
442
368
147
157
156
148
160
621
700
689
1,082
760
1,093
1,591
4,526
6,075
29,463
29,958
30,021
30,859
30,766
121,604
123,213
8,315
8,441
8,654
9,717
10,294
37,107
40,352
47
18
55
44
31
148
205
623
689
1,090
1,039
1,101
3,919
5,072
8,985
9,148
9,799
10,800
11,426
41,174
45,629
20,478
20,810
20,222
20,059
19,340
80,430
77,584
122
463
-
-
-
463
1,829
20,356
20,347
20,222
20,059
19,340
79,967
75,755
781
779
735
674
655
2,844
3,041
-
44
20
2
(28
)
38
759
107
48
110
1
3
161
153
854
877
846
891
799
3,413
3,281
312
342
306
336
308
1,292
1,199
537
577
609
290
706
2,182
2,445
=
2,591
2,667
2,626
2,194
2,443
9,930
10,878
x
$
5,716
$
5,753
$
5,729
$
5,657
$
5,626
$
22,764
$
24,873
843
877
738
774
875
3,264
3,786
1,101
1,068
1,103
1,151
1,207
4,530
4,235
242
234
267
245
226
972
1,129
209
229
136
286
195
846
1,017
933
1,001
955
803
948
3,706
4,109
1,440
1,461
1,624
1,809
1,504
6,398
6,912
603
-
-
-
-
-
-
11,087
10,623
10,552
10,725
10,581
42,480
46,061
11,860
12,391
12,296
11,528
11,202
47,417
40,572
2,326
2,224
2,829
2,658
2,510
10,221
8,886
9,534
10,167
9,467
8,870
8,692
37,196
31,686
-
-
-
-
-
-
276
$
9,534
$
10,167
$
9,467
$
8,870
$
8,692
$
37,196
$
31,410
x
QTD Average Balances and Yields/Rates (unaudited)
Table 4
Three Months Ended
March 31, 2026
December 31, 2025
Average Balance
Interest
Yield/ Rate
Average Balance
Interest
Yield/ Rate
$
1,883,103
$
27,675
5.9
%
$
1,807,127
$
27,866
6.2
%
140,223
1,099
3.1
%
152,782
1,011
2.6
%
85,953
689
3.2
%
116,517
1,081
3.7
%
2,109,279
29,463
5.6
%
2,076,426
29,958
5.8
%
(18,283
)
(17,954
)
205,119
190,810
2,296,115
2,249,282
575,981
2,809
1.95
%
518,495
2,647
2.0
%
412,533
1,425
1.38
%
427,419
1,585
1.5
%
479,804
4,081
3.40
%
475,972
4,209
3.5
%
60,522
467
3.09
%
60,781
444
2.9
%
20,355
203
3.99
%
24,953
263
4.2
%
1,549,195
8,985
2.32
%
1,507,620
9,148
2.4
%
430,842
434,578
27,593
47,299
458,435
481,877
288,485
259,785
2,296,115
2,249,282
20,478
20,810
3.27
%
3.32
%
3.88
%
4.02
%
2.32
%
2.37
%
1.82
%
2.43
%
x
YTD Average Balances and Yields/Rates (unaudited)
Table 5
Three Months Ended
March 31, 2026
March 31, 2025
Average Balance
Interest
Yield/ Rate
Average Balance
Interest
Yield/ Rate
1,883,103
27,675
5.9
%
1,794,477
27,930
6.2
%
140,223
1,099
3.1
%
186,604
1,245
2.7
%
85,953
689
3.2
%
150,891
1,591
4.2
%
2,109,279
29,463
5.6
%
2,131,972
30,766
5.8
%
(18,283
)
(18,109
)
205,119
176,014
2,296,115
2,289,877
575,981
2,809
2.0
%
581,411
3,326
2.3
%
412,533
1,425
1.4
%
383,685
1,435
1.5
%
479,804
4,081
3.4
%
564,710
5,533
3.9
%
60,522
467
3.1
%
64,361
442
2.7
%
20,355
203
4.0
%
43,951
690
6.3
%
1,549,195
8,985
2.3
%
1,638,118
11,426
2.8
%
430,842
395,414
27,593
36,110
458,435
431,524
288,485
219,940
2,296,115
2,289,582
20,478
19,340
3.27
%
2.98
%
3.88
%
3.63
%
2.32
%
2.79
%
1.82
%
2.25
%
Table 6
As of Quarter Ended
March 31, 2026
December 31, 2025
September 30, 2025
June 30, 2025
March 31, 2025
Amount
% of Total
Amount
% of Total
Amount
% of Total
Amount
% of Total
Amount
% of Total
$
1,114,516
58.7
%
$
1,113,440
59.2
%
$
1,002,192
56.5
%
$
1,016,229
57
%
$
1,029,444
57
%
195,189
10.3
%
176,688
9.4
%
201,399
11
%
189,187
11
%
180,066
10
%
383,346
20
%
377,943
20
%
376,769
21
%
376,442
21
%
372,338
21
%
14,511
1
%
14,824
1
%
14,831
1
%
15,290
1
%
16,406
1
%
171,029
9
%
174,248
9
%
154,732
9
%
178,832
10
%
182,186
10
%
12,260
1
%
15,417
1
%
16,009
1
%
14,636
1
%
14,908
1
%
7,237
0
%
7,450
0
%
7,642
0
%
7,772
0
%
7,505
0
%
1,898,088
100
%
1,880,010
100
%
1,773,574
100
%
1,798,388
100
%
1,802,853
100
%
5,914
6,477
6,381
6,872
7,675
18,329
18,096
17,942
17,989
18,109
1,873,845
1,855,437
1,749,251
1,773,527
1,777,069
x
Nonperforming Assets (unaudited)
Table 7
As of the Quarter Ended
March 31, 2026
December 31, 2025
September 30, 2025
June 30, 2025
March 31, 2025
$
5,861
$
6,245
$
5,390
$
5,846
$
4,808
-
-
-
6
20
5,861
6,245
5,390
5,852
4,828
575
253
533
861
565
$
6,436
$
6,498
$
5,923
$
6,713
$
5,393
$
18,329
$
18,096
$
17,942
$
17,989
$
18,109
$
1,892,174
$
1,873,533
$
1,767,193
$
1,791,516
$
1,795,178
0.31
%
0.33
%
0.31
%
0.33
%
0.27
%
0.34
%
0.35
%
0.34
%
0.37
%
0.30
%
313
%
290
%
333
%
307
%
375
%
0.97
%
0.97
%
1.02
%
1.00
%
1.01
%
0.25
%
0.27
%
0.24
%
0.26
%
0.21
%
x
Allowance for credit losses (unaudited)
Table 8
As of and for the Three Months Ended
As of and for the Twelve Months Ended
March 31, 2026
December 31, 2025
September 30, 2025
June 30, 2025
March 31, 2025
December 31, 2025
December 31, 2024
$
1,883,103
$
1,807,127
$
1,767,379
$
1,795,846
$
1,794,477
$
1,791,550
$
1,738,433
1,892,174
1,873,533
1,767,193
1,791,516
1,795,178
1,873,533
1,806,997
18,096
17,942
17,989
18,109
18,205
18,205
16,635
-
(284
)
-
(18
)
-
(301
)
(49
)
-
-
-
-
-
-
-
(121
)
-
(121
)
(52
)
-
(48
)
-
-
(314
)
(362
)
(177
)
(15
)
(13
)
(186
)
(34
)
(17
)
(251
)
(151
)
(15
)
(345
)
(186
)
(173
)
(331
)
(1,035
)
(429
)
114
-
108
33
10
151
75
-
-
-
-
202
201
-
20
26
2
16
64
9
1
7
1
3
-
11
54
11
56
4
15
7
83
32
126
83
139
53
235
510
170
111
(262
)
(47
)
(120
)
(96
)
(525
)
(259
)
122
416
-
-
-
416
1,829
$
18,329
$
18,096
$
17,942
$
17,989
$
18,109
$
18,096
$
18,205
0.97
%
0.97
%
1.02
%
1.00
%
1.01
%
0.97
%
1.01
%
0.01
%
-0.01
%
0.00
%
-0.01
%
-0.01
%
-0.03
%
-0.01
%
Loan Risk Ratings (unaudited)
Table 9
As of the Quarter Ended
March 31, 2026
December 31, 2025
September 30, 2025
June 30, 2025
March 31, 2025
$
1,105,529
$
1,104,532
$
999,788
$
1,012,190
$
1,023,884
8,897
8,814
1,776
2,515
4,182
90
94
628
1,524
1,378
$
1,114,516
$
1,113,440
$
1,002,192
$
1,016,229
$
1,029,444
$
194,983
$
176,014
$
201,363
$
189,149
$
180,066
171
78
-
-
-
35
596
36
38
-
$
195,189
$
176,688
$
201,399
$
189,187
$
180,066
$
377,179
$
371,583
$
371,226
$
371,353
$
367,216
545
833
838
849
854
5,622
5,527
4,705
4,240
4,268
$
383,346
$
377,943
$
376,769
$
376,442
$
372,338
$
14,511
$
14,824
$
14,831
$
15,290
$
16,406
-
-
-
-
-
-
-
-
-
$
14,511
$
14,824
$
14,831
$
15,290
$
16,406
$
170,093
$
173,324
$
153,819
$
177,969
$
181,255
701
793
733
747
808
235
131
180
116
123
$
171,029
$
174,248
$
154,732
$
178,832
$
182,186
$
12,162
$
15,317
$
15,974
$
14,594
$
14,866
44
21
5
6
7
54
79
30
36
35
$
12,260
$
15,417
$
16,009
$
14,636
$
14,908
$
7,237
$
7,451
$
7,642
$
7,773
$
7,506
-
-
-
-
-
-
-
-
-
$
7,237
$
7,451
$
7,642
$
7,773
$
7,506
$
1,881,694
$
1,863,045
$
1,764,643
$
1,788,318
$
1,791,199
10,358
10,539
3,352
4,117
5,851
6,036
6,427
5,579
5,954
5,804
$
1,898,088
$
1,880,011
$
1,773,574
$
1,798,389
$
1,802,854
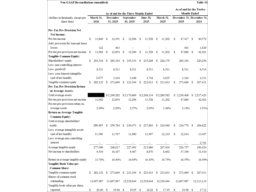
Non-GAAP Financial Measures
This press release contains certain financial measure(s) that are not financial measure(s) recognized under generally accepted accounting principles in the U.S. ("GAAP") and, therefore, are considered non-GAAP financial measure(s) and should be read along with the accompanying reconciliation of non-GAAP financial measure(s) to GAAP financial measure(s). We use non-GAAP financial measures, certain of which are included in this press release, both to explain our operating results to shareholders and the investment community and to evaluate, analyze, and manage our business. We believe that these non-GAAP financial measures provide a better understanding of ongoing operations, enhance the comparability of results across periods, and enable investors to better understand our performance. Our management believes that the "core" metrics described below and used in this press release assist users of the Company's financial statements with their financial analysis period-over-period as they exclude certain non-recurring items. However, non-GAAP financial measures should not be considered in isolation and should be considered supplemental in nature and not as a substitute for or superior to the most directly comparable or other financial measures calculated in accordance with GAAP. Additionally, the manner in which the non-GAAP financial measure(s) contained in this press release are calculated may differ from the manner in which measures with similar names are calculated by other companies. You should understand how other companies calculate their financial measures similar to, or with names similar to, the non-GAAP financial measure(s) contained in this press release when comparing such financial measures.
The non-GAAP financial measures in this press release include the following:
Core deposits. We calculate core deposits by excluding jumbo time deposits (deposits greater than or equal to $250,000) from total deposits.
Core net income. We define core net income as net income plus non-recurring expenses, net of the related tax effect of non-recurring expenses.
Core diluted earnings per share. We define core diluted earnings per share as core net income divided by diluted weighted average shares outstanding.
Core ROAA. We define core ROAA as core net income divided by average assets, with average assets based upon the average daily balance of total assets in each period.
Core return on average tangible common equity. We define core return on average tangible common equity as core net income divided by total average shareholders' equity less average intangible assets (goodwill and core deposit intangibles).
Core efficiency ratio. We define core efficiency ratio as operating revenue (net interest income, plus total noninterest income, divided by noninterest expenses (less non-recurring expenses). This ratio is an indicator used by our management to assess operating efficiencies and is intended to demonstrate how efficiently our management is controlling expenses relative to generating revenues on our core activities.
Efficiency Ratio. We define efficiency ratio as operating expenses divided by fee income plus tax equivalent net interest income. This metric indicates how effectively the Company manages its expenses relative to its income, providing insights into cost management and profitability.
Pre-tax, pre-provision ROAA. We define pre-tax, pre-provision ROAA as pre-tax, pre-provision net income divided by average assets calculated based upon the average daily balance of total assets in each year.
Tangible assets. We define tangible assets as total assets less goodwill and other intangible assets.
Tangible book value per share. We define tangible book value per share as our tangible common equity, which is shareholders' equity reduced by goodwill and other intangible assets, divided by diluted weighted average shares outstanding.
The following table provides a reconciliation of the above non-GAAP financial measures to their most directly comparable financial measure presented in accordance with GAAP.
Non-GAAP Reconciliations (unaudited)
As of and for the Three Months
Ended
As of and for the Twelve
Months Ended
March 31,
2026
December 31,
2025
September 30,
2025
June 30,
2025
March 31,
2025
December 31,
2025
December 31,
2024
$
11,860
$
12,391
$
12,296
$
11,528
$
11,202
$
47,417
$
40,572
122
463
-
-
-
463
1,829
$
11,982
$
12,854
$
12,296
$
11,528
$
11,202
$
47,880
$
42,401
$
293,518
$
285,344
$
245,153
$
235,268
$
226,179
285,344
220,256
-
-
8,511
8,511
8,511
8,511
8,511
8,511
8,514
2,875
3,164
3,448
3,744
4,035
3,164
4,331
$
282,132
$
273,669
$
233,194
$
223,013
$
213,633
$
273,669
$
207,411
$
2,296,115
$
2,249,282
$
2,170,869
$
2,248,134
$
2,289,582
$
2,239,468
$
2,217,423
11,982
12,854
12,296
11,528
11,202
47,880
42,401
2.09
%
2.29
%
2.27
%
2.05
%
1.96
%
2.14
%
1.91
%
288,485
$
259,784
$
239,473
$
227,883
$
219,940
$
236,770
$
206,622
11,386
11,767
11,980
11,997
12,310
$
12,014
13,497
-
-
-
-
-
-
2,701
277,099
248,017
227,493
215,886
207,630
224,757
190,424
9,534
10,167
9,467
8,870
8,692
37,196
31,410
13.76
%
16.40
%
16.65
%
16.43
%
16.75
%
16.55
%
16.49
%
$
282,132
$
273,669
$
233,194
$
223,013
$
213,633
$
273,669
$
207,411
13,697,987
13,697,987
12,239,644
12,239,644
12,239,644
13,697,987
12,113,114
$
20.60
$
19.98
$
19.05
$
18.22
$
17.45
$
19.98
$
17.12
As of and for the Three Months
Ended
As of and for the Twelve
Months Ended
March 31, 2026
December 31, 2025
September 30, 2025
June 30, 2025
March 31, 2025
December 31, 2025
December 31, 2024
$
282,132
$
273,669
$
233,194
$
223,013
$
213,633
$
273,669
$
207,411
2,328,789
2,291,455
2,214,408
2,262,511
2,266,878
2,291,455
2,301,211
12,392
12,767
13,149
13,546
13,938
12,767
14,339
2,316,397
2,278,688
2,201,258
2,248,965
2,252,940
2,278,688
2,286,872
12.18
%
12.01
%
10.59
%
9.92
%
9.48
%
12.01
%
9.07
%
$
1,892,217
$
1,815,734
$
1,780,634
$
1,851,248
$
1,902,206
$
1,815,734
1,938,597
116,966
102,294
100,743
97,209
97,537
102,294
94,567
41,533
47,970
47,970
125,223
145,375
47,970
174,918
$
1,733,718
$
1,665,470
$
1,631,921
$
1,628,816
$
1,659,294
$
1,665,470
$
1,669,112
$
9,534
$
10,167
$
9,467
$
8,870
$
8,692
$
37,196
31,410
603
-
-
302
7
309
2,788
(133
)
-
-
(76
)
(2
)
(78
)
(697
)
$
10,004
$
10,167
$
9,467
$
9,096
$
8,697
$
37,427
33,501
$
10,004
$
10,167
$
9,467
$
9,096
$
8,697
$
37,427
$
33,501
13,746,198
13,704,030
12,240,568
12,239,644
12,137,013
12,580,314
12,187,788
$
0.73
$
0.74
$
0.77
$
0.74
$
0.72
$
2.98
$
2.75
$
10,004
$
10,167
$
9,467
$
9,096
$
8,697
$
37,427
$
33,501
2,296,115
2,249,282
2,170,869
2,248,134
2,289,582
2,239,468
2,217,423
1.74
%
1.81
%
1.74
%
1.62
%
1.52
%
1.67
%
1.51
%
$
277,099
$
248,017
$
227,493
$
215,886
$
207,630
$
224,757
$
190,424
10,004
10,167
9,467
9,096
8,697
37,427
33,501
14.44
%
16.40
%
16.65
%
16.85
%
16.75
%
16.65
%
17.59
%
$
20,478
$
20,810
$
20,222
$
20,059
$
19,340
$
80,431
$
77,584
2,591
2,667
2,626
2,194
2,443
9,930
10,878
$
23,069
$
23,477
$
22,848
$
22,253
$
21,783
$
90,361
88,462
11,087
10,623
10,552
10,725
10,581
42,481
46,061
603
-
-
302
7
309
2,788
10,484
10,623
10,552
10,423
10,574
42,172
43,273
45.45
%
45.25
%
46.18
%
46.84
%
48.54
%
46.67
%
48.92
%
Contacts
Philip J. Metheny
Sr. Executive Vice President, Chief Financial Officer
Commercial Bancgroup, Inc.
[email protected]
423-869-5151
Roger Mobley
Executive Vice President, Chief Financial Officer
Commercial Bank
[email protected]
704-648-0185
Commercial Bancgroup, Inc.
Forward-Looking Statements
This press release contains statements that constitute "forward-looking statements" within the meaning of the U.S. federal securities laws. The statements in this press release that are not purely historical facts are forward-looking statements. These forward-looking statements are generally identified by the use of forward-looking terminology, including the terms "anticipate," "believe," "could," "estimate," "expect," "intend," "may," "plan," "potential," "predict," "project," "should," "target," "will," "would" and, in each case, their negative or other variations or comparable terminology and expressions. You should not place undue reliance on these forward-looking statements as actual future results may differ materially from those expressed or implied by any forward-looking statement. These forward-looking statements are subject to known and unknown risks, uncertainties and other factors that could cause actual results to differ materially from those expressed in any forward-looking statements, including but not limited to: (1) business and economic conditions nationally, regionally and in our target markets, particularly in Kentucky, North Carolina and Tennessee and the particular geographic areas in which we operate; (2) the level of, or changes in the level of, interest rates and inflation, including the effects thereof on our earnings and financial condition and the market value of our investment securities and loan portfolios; (3) the concentration of our loan portfolio in real estate loans and changes in the prices, values and sales volumes of commercial and residential real estate; (4) the concentration of our business within our geographic areas of operation in Kentucky, North Carolina and Tennessee and neighboring markets; (5) credit and lending risks associated with our commercial real estate, commercial, and construction and land development loan portfolios; (6) risks associated with our focus on lending to small and medium-sized businesses; (7) our ability to maintain important deposit customer relationships, maintain our reputation or otherwise avoid liquidity risks; (8) changes in demand for our products and services; (9) the failure of assumptions and estimates underlying the establishment of allowances for possible credit losses and other asset impairments, losses, valuations of assets and liabilities and other estimates; (10) the sufficiency of our capital, including sources of such capital and the extent to which capital may be used or required; (11) our inability to maintain a "satisfactory" rating under the Community Reinvestment Act; (12) the risk that our cost of funding could increase in the event we are unable to continue to attract stable, low-cost deposits and reduce our cost of deposits; (13) our inability to raise necessary capital to fund our growth strategy and operations or to meet increased required minimum regulatory capital levels; (14) our ability to execute and prudently manage our growth and execute our business strategy, including expansionary activities; (15) the composition of and changes in our management team and our ability to attract, incentivize and retain key personnel; (16) the effects of competition from a wide variety of local, regional, national and other providers of financial, investment, trust and other wealth management services and insurance services, including the disruptive effects of financial technology and other competitors who are not subject to the same regulations as the Company and the Bank; (17) the deterioration of our asset quality or the value of collateral securing loans; (18) changes in accounting standards; (19) the effectiveness of our risk management framework, including internal controls; (20) severe weather, natural disasters, pandemics, epidemics, acts of war, terrorism, or other external events, such as the transition risk associated with climate change, and other matters beyond our control; (21) changes in technology or products that may be more difficult, more costly, or less effective than anticipated; (22) the risks of acquisitions and other expansionary activities, including without limitation our ability to identify and consummate transactions with potential future acquisition candidates, the time and costs associated with pursuing such transactions, our ability to successfully integrate operations as part of such transactions and our ability, and possible failures, to achieve expected gains, revenue growth, expense savings and/or other synergies from such transactions; (23) our ability to maintain our historical rate of growth; (24) failure to keep pace with technological change or difficulties when implementing new technologies; (25) systems failures or interruptions involving our risk management framework, our information technology and telecommunications systems or third-party service providers; (26) our ability to identify and address unauthorized data access, cyber-crime and other threats to data security and customer privacy; (27) our compliance with governmental and regulatory requirements, including the Bank Holding Company Act of 1956, as amended, and other laws relating to banking, consumer protection, securities and tax matters, and our ability to maintain licenses required in connection with mortgage origination, sale and servicing operations; (28) compliance with the Bank Secrecy Act of 1970, Office of Foreign Assets Control rules and anti-money laundering laws and regulations; (29) governmental monetary and fiscal policies; (30) changes in laws, rules, or regulations, or interpretations thereof, or policies relating to financial institutions or accounting, tax, trade, monetary or fiscal matters; (31) our ability to receive dividends from the Bank and satisfy our obligations as they become due; (32) the institution and outcome of litigation and other legal proceedings against us or to which we become subject; (33) the limited experience of our management team in managing and operating a public company; (34) the incremental costs of operating as a public company; (35) our ability to meet our obligations as a public company, including our obligations under Section 404 of the Sarbanes-Oxley Act of 2002; and (36) other risks and factors described under the sections titled "Risk Factors" and "Management's Discussion and Analysis of Financial Condition and Results of Operations" in our Annual report on Form 10-K for the fiscal year ended December 31, 2025, or in any of the Company's subsequent filings with the U.S. Securities and Exchange Commission. Commercial undertakes no obligation to update these forward-looking statements, as a result of changes in assumptions, new information, or otherwise, after the date of this press release, except as required by law.
SOURCE: Commercial Bancgroup, Inc.